
How to Price Freight When Your Own Data Lies to You
Dirty data in pricing models and why the most confident rates can be the most wrong.
It is Tuesday morning. The model drops a rate for a lane your best rep knows cold. The number is crisp. It is confident. It is wrong.
Not random-wrong. Repeatable-wrong. Low when capacity tightens. High when your incumbents are hungry. Misses the turns your people feel before they see them in a chart.
So the team does what teams always do. They debate the output, add guardrails, build exceptions, schedule a meeting about the exceptions, and slowly (quietly) they stop trusting the thing they spent months standing up.
Here’s the part nobody puts in the vendor deck: the model is usually doing exactly what you trained it to do. The problem is not the algorithm. It’s the story your historical data is telling…and that story has some significant plot holes.
If you run pricing, ops, or brokerage strategy, this is the real AI pricing risk. Not model immaturity. Confident wrong answers, at scale, delivered fast.
The Root Problem: Your Data Is Not Reality. It’s a Highlight Reel.
Most pricing tools assume clean inputs. A few mention data cleanup as a feature. Almost none treat it as the core thing leaders need to understand before they buy.
Because the hardest problem isn’t missing fields. It’s distorted history.
Your lane history is seasonally biased, carrier-skewed, and volume-distorted. Feed that into a model without confronting those distortions and you don’t get a smarter pricing engine. You get a faster way to repeat yesterday's mistakes, with better formatting and more confidence.
Three distortions cause most of the damage.
Why Your Historical Lane Data Lies to You
1. Seasonal Bias
Freight isn’t stationary. Peak season, produce cycles, weather, port disruption, holiday retail surges - these repeat, but they don’t distribute evenly across your dataset.
If your history overweights certain months or event periods, your model learns a season, not a lane. This shows up in a very familiar way: rates that look reasonable on average and break badly when the calendar turns.
2. Carrier Skew
Your historical costs reflect who you used to cover freight - not the full cost landscape of the lane.
If a lane runs on incumbents or a specific procurement strategy, the model learns that structure. It gets excellent at predicting the past you experienced, and fragile the moment you need to cover with different carriers, different lead times, or different service requirements.
In other words, it’s not modeling the market. It’s modeling your relationships. Those are not the same thing.
3. Volume Distortion
High-volume lanes dominate training data. Low-volume lanes (the ones that create the most operational risk when priced wrong) often have the least statistical support.
Your model becomes strong exactly where you need it least, and weak exactly where things go sideways.
These are not bad data in the traditional sense. Every record is a real shipment, a real invoice. They’re just not representative training material for the decision you are asking the model to make.
The Modern Failure Mode: Confident Wrong Answers
Everyone knows "garbage in, garbage out." But AI pricing introduced a more dangerous version of the problem.
Modern models don’t output vague wrong numbers. They output precise wrong numbers - tight ranges, clean confidence bands, and a tone that makes humans stop questioning.
That confidence changes behavior in ways that compound quietly:
Pricing teams stop challenging outputs and start managing exceptions
Ops inherits the downside when the rate is wrong and coverage fails
Leadership sees consistency and assumes correctness
The organization automates more decisions on top of a flawed base
The real question is never "is the model good?" It is: "Is the training data telling the truth?"
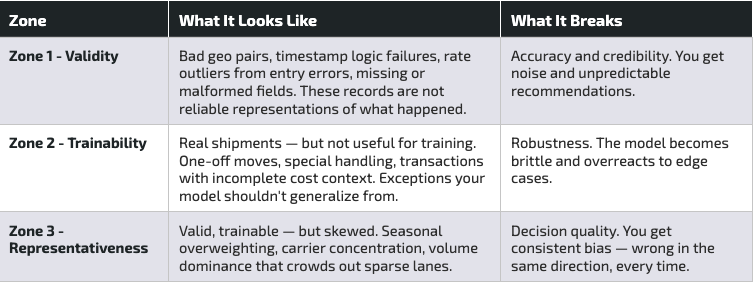
The Dirty Data Map: A Framework for What Actually Goes Wrong
If you want AI pricing to earn trust inside your brokerage, you need a shared language for how data fails and what to do about each type of failure.
Think of it as three zones, each with a distinct failure signature:
Red Flags: How to Know Your Data Is Misleading the Model
For leaders, the most useful signal is not a list of data fields to check. It is a set of operational symptoms that point to the underlying distortion.
If you are seeing these patterns, your training data is likely lying in a very predictable way:
The model is consistently low during predictable, tight periods. That is seasonal underrepresentation.
The model matches incumbent outcomes but fails on spot or new carriers. That is carrier skew.
The model performs well on your top lanes and collapses elsewhere. That is volume distortion.
The model improves dramatically after removing a small fraction of shipments. That signals contamination from outliers or invalid records.
Backtests look excellent. Live performance degrades quickly. That often points to timestamp integrity issues or fields that cannot be trusted in production.
None of this is your team's fault. Brokerage data is created under pressure, by people moving freight, and the systems reflect that reality. The goal isn’t blame, it’s visibility.
Data Validation Is Not a Backend Feature. It’s a Leadership Tool.
Most freight brokerages treat data quality as a technical prerequisite - something the data team handles before the model goes live. The better framing is governance.
If pricing is a strategic function, the inputs shaping pricing decisions must be auditable. When you ingest customer shipment data at scale — historical transactions, costs, carrier details, and a daily feed of new loads — you will find issues. The question is whether those issues stay hidden or become visible, measurable, and fixable.
The output leaders actually want sounds simple:

That kind of transparency does two things.
First, it makes model performance explainable - not academically, but in a way that helps you run the business.
Second, it turns data quality into an operational feedback loop. If excluded shipments cluster around a specific workflow, a specific customer onboarding pattern, or a specific TMS behavior, you have found a systemic process issue. Fixing it improves the model and the health of the brokerage.
A Word on Privacy and Why It Changes the Math
Many pricing solutions paper over data quality problems by leaning on aggregated or anonymized market data. Blended estimates can hide the cracks. They also dilute your competitive edge.
Transfix's approach is different: your model is built on your data, tailored to your business, never pooled across other brokers or shippers. No anonymized blending. No risk that your operational patterns quietly show up in a competitor's cost predictions.
There is a practical implication leaders should not ignore. Privacy-preserving personalization raises the ceiling on competitive advantage, and it raises the floor on data discipline. If you want a model that learns your playbook, you need to make sure your history is telling the truth.
The Questions Worth Asking Before You Scale AI Pricing
If your AI pricing feels inconsistent, brittle, or hard to defend in a shipper conversation, the fastest path to improvement is rarely a better algorithm. It’s a more honest relationship with your own data.
When you can answer these questions with confidence, you can scale AI pricing with fewer guardrails and more trust:
What percent of our shipment history is truly trainable for cost modeling?
What are the top reasons data is excluded, and are they solvable?
Where are we seasonally biased, carrier-skewed, or volume-distorted?
Which lanes are most likely to produce confident wrong recommendations, and why?
What process changes would improve both operational execution and pricing accuracy?
That is the difference between "we have a model" and "we have a system."
Want to See Your Dirty Data Map?
If you're leading pricing or operations and want to know what your historical data is actually teaching your model, including where it is likely to produce confident wrong answers, let's look at it together.
Transfix trains tailored cost models on your data, and only your data. The first step is understanding what that data is telling us, and what it isn't.
And if you’re exploring a few solutions at the same time, we love a good head-to-head test comparing the accuracy of our models after training them with your data. (It’s where we shine!)