
Freight Pricing That Thinks Like You Do: Inside Transfix Custom Cost Models
How brokers and 3PLs use live cost models (not rate indexes) to price spot and contract freight with more accuracy, fewer disputes, and stronger buying power.
If you run pricing, brokerage, or carrier sales, you don’t need another rate index.
You need a live view of what the market is doing and how you actually buy, so you can put out numbers your team can win and cover with.
That is the whole point of Transfix Custom Cost Models and Smart Pricing & Quoting: they compare your buying history with current market conditions, then predict the best rate for your strategy and risk tolerance across both spot and contract freight.
Organizations using Custom Cost Models are already seeing a 20-30% improvement in rate accuracy and fewer internal pricing disputes.
Let’s talk about what that actually means if you are responsible for a P&L, a desk, or a carrier network.
Indexes are snapshots. Your book is a live feed.
Indexes have a role. They tell you, in broad strokes, what the market has been paying. But that’s not the same as telling you what you should pay today on a specific lane, for a specific customer, with your carriers and your service promises.
You know you are stuck in index-land when:
Every pricing conversation starts with “what does [index] say?” and ends with “yeah, but that doesn’t feel right for this lane.”
Indexes are backward-looking and generic. Your freight network is neither.
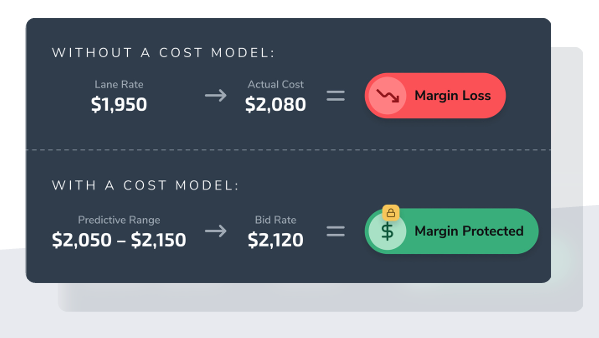
Custom Cost Models start from a different premise: your pricing system should understand how you have been buying freight, blend that with live market data, and present you with a cost curve that reflects your reality, not an industry average.
So what is a Custom Cost Model, really?
Inside the Transfix platform, there are two core models behind our Rates Tool and Smart Pricing & Quoting experience: one for spot and one for contract.
The spot model looks at how you and the broader market have bought a lane recently, interprets the patterns, and produces a predicted cost range for the next several weeks. It’s watching your history and the market’s behavior at the same time.
The contract model takes that same understanding and pushes it over the duration of an RFP. It doesn’t just answer “what is a fair rate today,” it asks “how is this lane likely to behave over the next 6, 9, or 12 months if we win this award” and prices accordingly.
Under the hood, both models are trained on three kinds of input:
Your data. Your historical buy rates, lane performance, how specific carriers have behaved with you, and how your team has actually covered freight over time.
Market data. Live and historical signals from providers like DAT and SONAR, plus AI-driven clustering that lets adjacent lanes reinforce each other when you do not have deep history on a lane.
Your business logic. Geography, customers, length of haul, equipment type, drop profile, and risk appetite are not afterthoughts. They are configurable in a Control Panel, so the model reflects how you actually run your book, not a generic brokerage.
The result isn’t a rate table. It is a living cost model that updates as your network and the broader market move.
From model to workflow: Smart Pricing & Quoting
A good model that lives in a slide deck is trivia. A good model that lives inside your daily workflow is leverage.
Smart Pricing & Quoting wires Custom Cost Models directly into the tools your team already uses to quote, whether that is inside the Transfix TMS or via the standalone Solutions Console. You get one source of truth for spot and contract pricing, not one tool for each.
That shared engine powers:
Real-time rate generation. Accurate spot and contract rates in seconds, grounded in both your history and live market signals.
Configurable pricing rules. Guardrails around margin floors, customer segments, regions, and risk posture, so your team does not reinvent strategy on every quote.
Quote Management and feedback loops. Every quote, every win and loss, and every override is tracked. That means you can see where the model is being trusted, where it is being second-guessed, and what that means for your results.
Performance visibility. You can see how pricing decisions are affecting profitability and carrier engagement, instead of guessing from a margin report at month's end.
APIs instead of extra tabs. If you have internal systems you love, the model can sit behind them via API. Brokers don’t need one more screen to log into.
And because the same cost engine supports our RFP tools, that intelligence travels with you from daily spot quoting into high-stakes contract events.
Spot: quoting at the pace your sales team sells
On the spot side, the Custom Cost Model behaves like a constantly updating playbook for each lane.
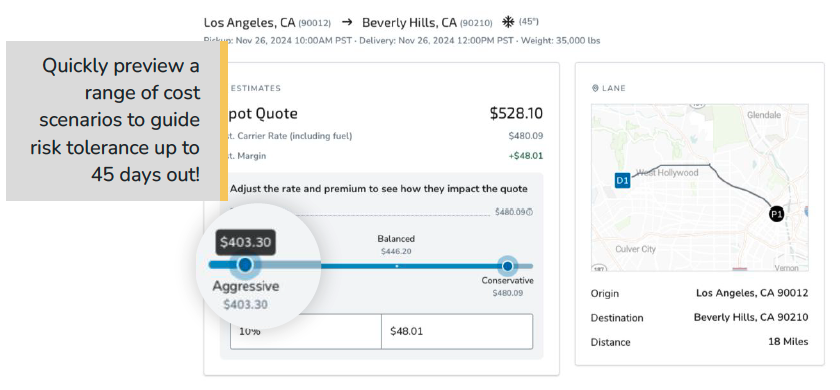
When a broker requests a rate, the Rates Tool surfaces a cost curve for that lane based on your historical buys and recent market movements, then offers clear positions along that curve: aggressive, balanced, conservative.
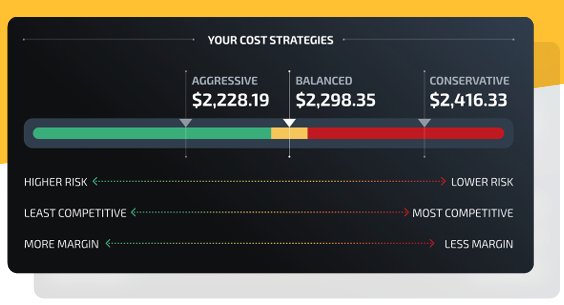
Aggressive positions are closer to the lower bound of likely carrier cost. They are useful when the lane is relatively stable or when your strategy is to win share, and you accept more risk on coverage.
Balanced positions hug the heart of the distribution. That is the default in Smart Pricing & Quoting, and it is calibrated to give you consistent coverage and predictable margin across day-in, day-out freight.
Conservative positions sit near the upper bound. They are designed for critical freight and sensitive accounts where failure is expensive, and stability is the priority.
The key is that the distance between those positions reflects actual volatility on that lane. When the spread is wide, that is a signal to slow down and think strategically. When it is narrow, you can make decisions faster with more confidence.
All of this happens in seconds, not after an afternoon of spreadsheet review. (Can you already hear the breath of relief?)
Contract: RFPs with an actual forward view
In contract pricing, the same modeling logic is extended over time.
The Transfix RFP Workflow Tool lets your team upload thousands of lanes, apply Custom Cost Models across the portfolio, and see projected costs over the life of the contract. Rather than applying a flat uplift everywhere, you can see where risk is concentrated and where you can afford to be sharper.
Because pricing, forecasts, and RFP status live in one place, your organization stops playing “version control roulette” with spreadsheets. Sales, pricing, and operations are looking at the same numbers and the same risk picture, not three different versions of reality.
That shift is why we measure not just raw accuracy, but metrics like MAPE and MPE to understand where your network is introducing risk and where your buying process can be tightened. Accuracy, in our world, is not a trophy number. It is a way to highlight where your strategy needs attention.
What changes for leaders
For directors of pricing and brokerage leaders, the biggest change is not a new dashboard. It is the quality of decisions across your org.
Pricing conversations become more objective. When everyone is looking at the same live cost curve for a lane, arguments shift from “what is the right number” to “what are we trying to accomplish here,” and “how much risk are we willing to take for this account.”
Carrier conversations get sharper. You can talk about how a lane has actually performed for you, how the market is trending, and where you are positioning price, instead of negotiating from generic benchmarks.
Shipper conversations gain credibility. When a customer challenges a rate, you can explain how it lines up with both your historical costs and the market trajectory, and what levers exist to adjust service levels, commitments, or risk posture if needed.
And because organizations using Custom Cost Models are seeing a 20-30% improvement in rate accuracy and fewer internal pricing disputes, you are not just getting nicer charts. You are getting fewer escalations and cleaner margin outcomes.
How to think about a rollout
If you’re responsible for keeping a book both competitive and profitable, here’s a simple way to frame it:
Audit your status quo
How many tools and exports does your team consult before they quote?
How often do you have to referee internal disputes over “the right” rate?
How much of your strategy lives in someone’s head instead of in a system?
Make your objectives explicit
Are you optimizing for award retention, margin stability, growth in certain regions, or a mix?
Should different segments (enterprise vs mid-market, contract vs spot) follow different risk profiles?
Pick a proving ground
Start with a subset of lanes, a core region, or an upcoming RFP where the pain is obvious.
Use Transfix Custom Cost Models and Smart Pricing & Quoting as the single source of truth for that slice of the business.
Watch what changes
Win rate, margin, speed to quote, and number of pricing escalations.
The quality of conversations inside your team and with customers and carriers.
As one customer put it, integrating this kind of insight lets them deliver better service, streamline operations, and raise the bar on efficiency and customer outcomes.
That’s the point.
You’re not buying a prettier index. You’re putting a live, custom freight cost model at the center of your business: one that sees your history, reads the market, and helps your team price like the high-performing brokerage you’re building for the long term.